
Workflow Studio analytics
Introduction
Workflow Studio comes with a comprehensive analytics dashboard offering customers visibility into how identity verification journeys are performing. By surfacing where applicants drop off, which steps have low approval rates and how identity verifications are performing, Studio analytics enable you to quickly identify opportunities to improve conversion and increase acquisition, as well as spot areas of risk where workflow changes may be needed to prevent fraud.
This guide offers insights into some of the key Studio analytics you will need to understand to help you interpret the metrics and make informed, data-driven decisions regarding your identity verification workflows.
Understanding the key analytics metrics
The workflow analytics dashboard is divided into two high-level sections: workflow-level metrics and task-level metrics.
Workflow-level metrics
When selecting the Workflow tab in the analytics dashboard, you will find a range of metrics that apply at the workflow level. This includes:
- the total number of workflow runs
- the percentage of workflow runs in progress
- the percentage of workflow runs abandoned
- the percentage of workflow runs in error
- the percentages of workflows and their various result states (Approved, Review, Declined)
- workflow run trends over time
These performance metrics can be filtered by the workflow start date, specific workflows or workflow versions and workflow run tags.
Task-level metrics
When selecting the Task tab in the analytics dashboard, you will find a range of metrics that apply at the workflow task level. The task performance table shows the clear rate for each task within the selected workflows.
These performance metrics can be filtered by the workflow start date, specific workflows or workflow versions and workflow tags and task instances.
Document Report task analytics
For the Document Report task in particular, the analytics dashboard offers a more detailed range of task metrics, including:
- the total number of completed tasks
- the median task duration
- the task's Clear, Caution, Suspected or Rejected rates
- the percentage of Document Report tasks in error
- Document Report task performance trends over time
- a detailed sub-breakdown table for Document Report task results
- analysis of performance by document type
These Document Report task metrics can be filtered by the workflow start date, specific workflows or workflow versions, document type, workflow tags and task instances.
Workflow run performance vs applicant performance
Workflow performance in Studio can be measured at two distinct levels - workflow run level and applicant level. The difference between these two metrics lies in how retries and multiple workflow run attempts are counted.
At the workflow run level, every individual instance of a workflow being executed is calculated as a separate analytics data point. At the applicant level, performance is measured per individual rather than per verification attempt.
For example, if a single applicant starts a workflow, fails on their first attempt (for example, submitting a document photo with glare), and then successfully completes a second workflow run, the analytics records two workflow runs: one failed and one approved. This would result in a 50% approval rate for that user's activity on a workflow run level, but a 100% approval rate on an applicant level.
This distinction is important when trying to understand genuine conversion, as workflow run-level metrics can be skewed downward by legitimate retry attempts, whereas applicant-level metrics give a more accurate picture of how many real users are successfully completing the verification journey.
Analytics filters
The Studio analytics dashboard includes a range of filters enabling you to get a more granular view on workflow results. These include:
- Tags filter – workflow tags are text labels that can be applied to individual workflow runs to categorize them. These tags can then be used to segment workflow performance data in the analytics dashboard. Please note: workflow tags must never contain PII
- Workflow version filter - each time a workflow is updated, a new version is created. Filtering by workflow version allows you to isolate performance data to a specific version - for example, to compare how approval rates changed before and after a workflow change was implemented
- Task instance filter - workflows can contain multiple instances of the same task type - for example, a Document Report task used in two different branches. A task instance refers to one specific occurrence of a task within a workflow. The task instance filter enables you to analyze the performance of a specific task within a workflow, rather than combining metrics from every instance of the same task type. This is particularly useful when a task appears in multiple workflow branches, allowing you to compare how each instance performs independently. For example, you can determine whether a Document Report task in a retry path has a different completion rate than the same task in the primary workflow path
Understanding Flow Analysis
The Flow Analysis component of the Studio analytics dashboard provides a visual interface of how end users progressed through your verification workflows. Flow Analysis helps you to identify, diagnose and improve the end user onboarding experience by surfacing where users drop off or encounter specific decision branches. In particular, the analysis illustrates:
- End-user progression - Flow Analysis visualizes how applicants move through the steps and branches of a workflow, highlighting the number of workflow runs initiated (called
Started), the percentage and number of times a particular task was completed (calledProgressed), the percentage and number of times report tasks cleared (calledClear) and the number and volume of end users routed through each conditional branch in a workflow - Drop off points and bottlenecks – Flow Analysis highlights at what stage of a workflow end users are either stopping or failing
- Approved, Review and Declined rates – Flow Analysis visualizes the percentage and number of times the workflow runs ended with an Approved, Review or Declined result
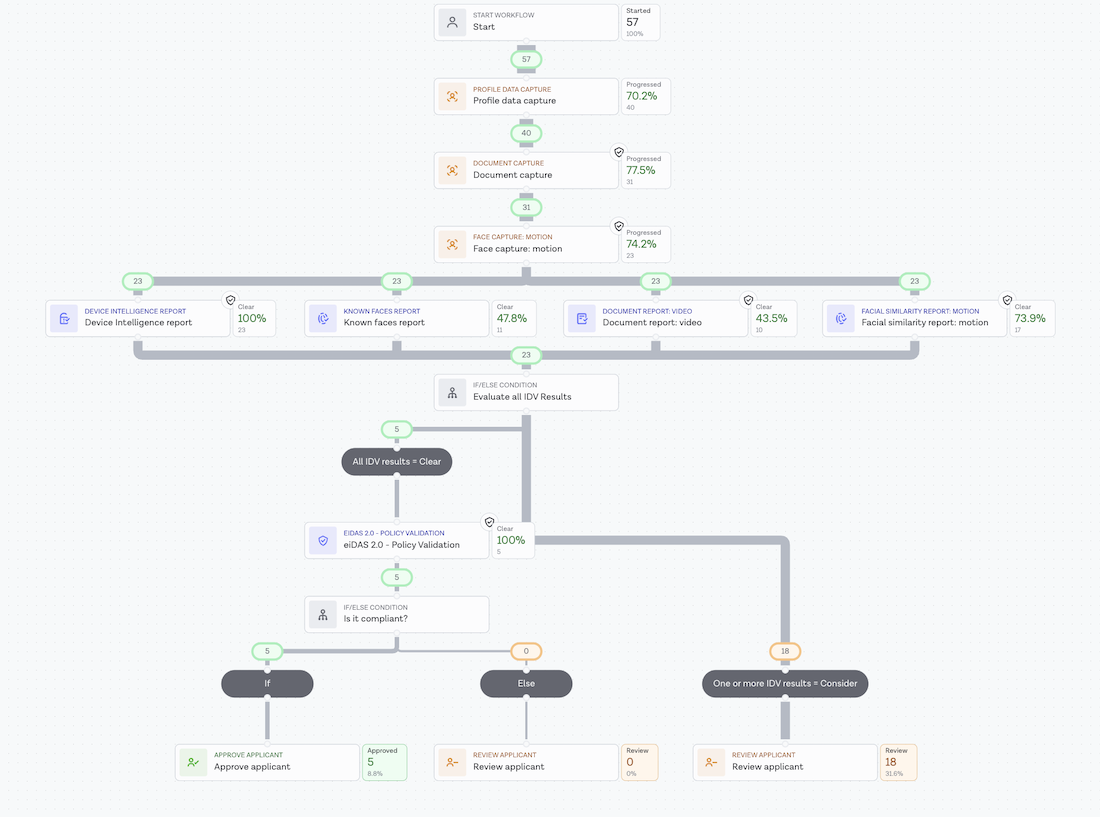
An example of Flow Analysis
It is important to note that in Flow Analysis, the number of workflow runs started may be lower than the execution counts shown for individual workflow steps. This can occur when retry tasks are configured, as a single workflow run may loop back and pass through the same step multiple times without creating a new workflow run. As a result, downstream execution counts can be higher than the total number of workflow runs started.
In-progress workflow runs vs abandoned workflow runs
The workflow analytics dashboard includes two distinct but closely related metrics – in-progress workflows and abandoned workflows - which should be viewed and interpreted together.
A workflow run is considered in progress when an applicant has started the workflow but has not yet completed it. A workflow run is abandoned when it has expired, meaning an applicant did not complete an interactive task within the configured timeout window.
There are many reasons why an applicant hasn't yet completed a workflow run, and there is a possibility they will eventually return. However, the longer a workflow run remains in progress, the greater the likelihood it will eventually be abandoned. As such, in-progress workflow runs can be seen as a leading indicator of abandonment, and should therefore be closely monitored to help identify these trends earlier.
Important considerations when using workflow analytics
To ensure workflow analytics data is interpreted correctly, it is important to understand how Workflow Studio collects, processes and retains analytics information. The following considerations can help prevent common misunderstandings when reviewing metrics and trends.
Analytics data semantics
All Workflow Studio Analytics metrics are based on the workflow start date. As workflows that were previously in progress reach completion, workflow-level metrics such as Approved, Review, Declined and Error rates may change as in-progress workflows reach completion.
Similarly, as workflow tasks complete after the workflow start date, task analytics figures may continue to be updated. For example, Document Report tasks are only counted once they have completed. As a result, task-level metrics may change after the workflow start date as in-progress workflows continue to execute and reach completion.
Please note that Document Report task counts are intended for operational analytics and do not correspond to customer billing metrics.
Data availability
Analytics data is refreshed every two hours, so recently completed workflow activity may not immediately appear in the dashboard.
Analytics data is available for a maximum period of one year.
Flow Analysis behavior
In Flow Analysis, different workflow task types are counted at different stages of execution:
- Capture tasks are counted when the task starts
- Report tasks are counted when the task completes
Because of this difference, task counts may not increase at the same rate throughout the workflow lifecycle as some metrics reflect task initiation while others reflect successful task completion.